Quantitative-Big-Imaging-2018
The material for the Quantitative Big Imaging course at ETHZ for the Spring Semester 2018
View the Project on GitHub kmader/Quantitative-Big-Imaging-2018
Downloading the data
-
The data for the example can be downloaded from here and extract the train.zip file
-
Open the file in Archive Manager and extract the data to
/scratch(only on D61.1 machines) -
For each .tif file there is an associated _mask.tif corresponding to the ground truth
Many of these workflows are fairly complicated and would be time consuming to reproduce, follow the instructions here for how to import a workflow from the zip files on this site
Problems!
If you load a workflow and get an error message, click on the details button. If it says ‘Node … not available’ it means you need to update your ‘Image Processing Extensions’ follow the instructions below to perform this update: instructions
- If you cannot find the ‘Salt and Pepper’ node, this also means you are not using the latest Image Processing Extensions so update it as described above
Getting Started
-
Steps are shown in normal text, comments are shown in italics.
-
Knime Basics: here
-
Use workflow variables: here
Exploring ROC Curves
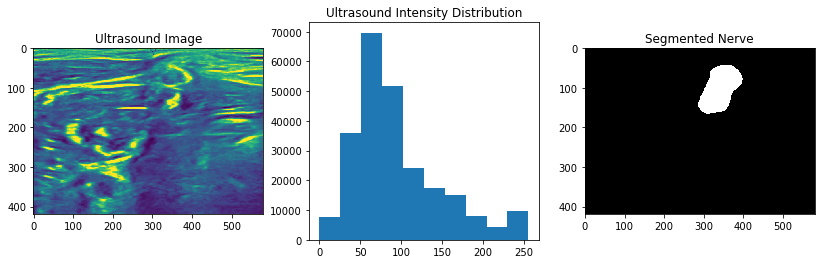
The task from the lecture of identifying the nerve in the ultrasound image
 .
.
We thus have these data loaded in the workflow as the image and ground truth respectively.
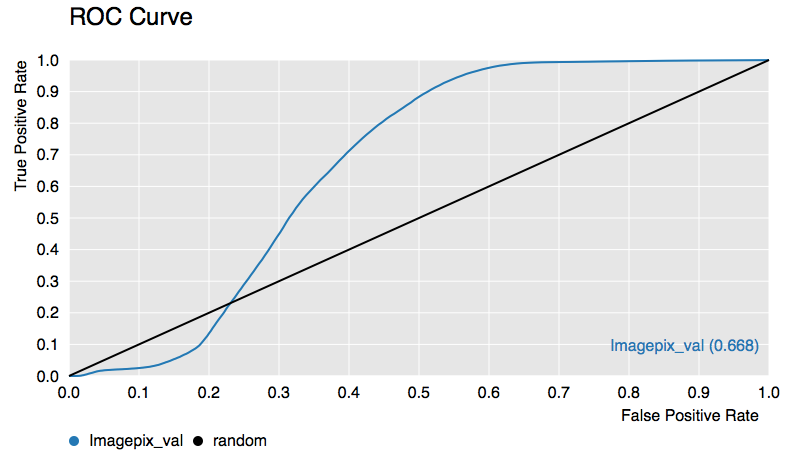
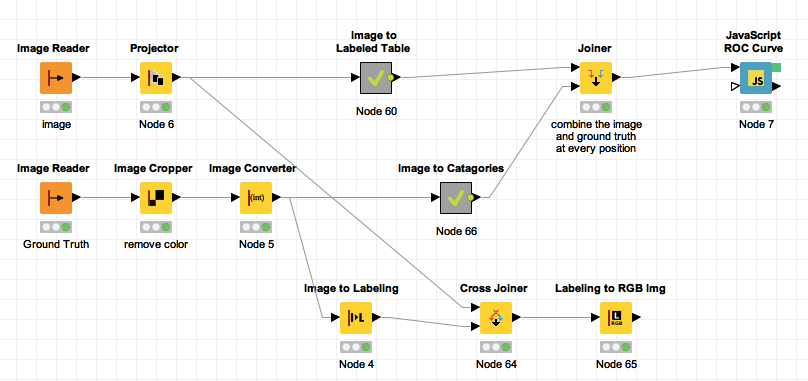
The ROC curve’s discussed in the last lecture we will use as a tool for evaluating our accuracy for the rest of the course. An example work-flow is below to generate the above curve.
Download the workflows here
Tasks
- Where does filtering come into this workflow?
- Which filter elements might improve the area under the ROC?
- Try making workflows to test out a few different filters
- Where might morphological operations fit in?
- How can you make them part of this workflow as well?
- (Challenge) Use the
Parameter Optimization Loop Startnode to find the best filter size to maximize the ROC area